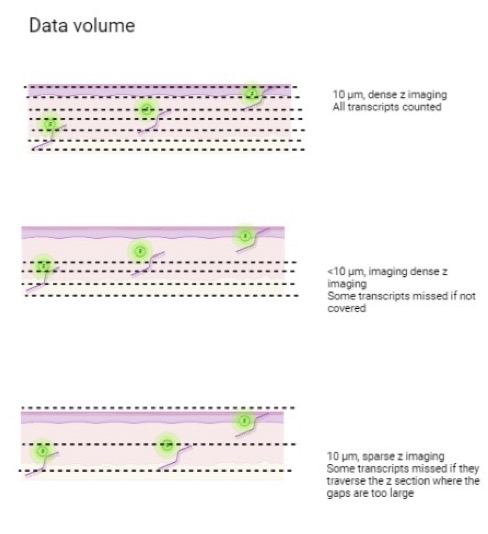
Data volume
A tissue section is not a flat 2D section, so its volume in all 3D needs to be considered. Z-stack imaging allows multiple images to be taken at a set of intervals on the planes of tissues. Combining these images can create a deep field of view of the sample. Many imaging-based spatial transcriptomics technologies perform sparse Z-imaging to expand the imaging area. However, low abundance transcripts are often missed.
What if you could receive dense datasets where rare cell types and events can be identified even if with low expression? Learn more about the data volume of Molecular Cartography here.

Plexity
Multiplexing
In situ imaging technologies have the advantages of high spatial resolution and detection efficiency but are often limited by the number of RNA species that can be profiled. Some technologies allow researchers to work with higher RNA plexity. However, profiling more RNA species often leads to compromises in sensitivity and specificity due to optical crowding increases.
We understand sensitivity and accuracy are critical to identifying rare cell events and revealing the unrecognized complexity within tissues. Profiling 100 RNA species using a fully customized gene panel hits the “sweet spot” for most applications without compromising data quality. Researchers can detect highly and lowly expressed genes with assurance and fully utilize the dynamic range to focus on what matters to their research questions.
Tissue types
Not every tissue is compatible with spatial technologies due to complexity such as tissue structure, the microenvironment, autofluorescence, etc. Often, tissue protocols need to be optimized and tested to be fully compatible and obtain the best possible results. However, many spatial technologies have a narrow range of compatible tissues because of the cumbersome sample preparation.
Unlike many other spatial technologies, the Molecular Cartography system doesn’t require tissue clearing or enzymatic procedures. Because of its simple protocol and native approach, the Molecular Cartography system has the advantage of being optimized for a wide variety of tissue types and species, including mice, humans, plants, and other model organisms. At AGBT 2022, 20 leading scientists demonstrated the power of our technology across 12 different tissues and species.
Tissue integrity
Assessing gene expression profiles of different tissues can be a daunting challenge for in situ assays due to their autofluorescence and the structure of the microenvironment. Although some methods circumnavigate these barriers by applying tissue clearing or extracting the transcripts from their original position into a single plane, these approaches destroy the tissue structure. Hence, you would get a distorted view of transcript location and makes it impossible for further interrogation after the assay.
What if there was a straightforward and unbiased approach that does not disrupt the tissue, so you can perform follow-up analysis with additional probes or antibody staining? Learn more about Molecular Cartography here.
Panel design flexibility
Labeling a target RNA requires a set of encoding probes, which contain sequences that can bind to the target RNA with high sensitivity and specificity. Techniques that rely on just one or a few probes per transcript may fail to detect the correct transcript, giving a false positive signal. However, using tens of probes per transcript requires an intelligent probe design to cover all the genes of interest.
The probe design of many in situ technologies might require additional criteria, which increase the complexity. Therefore, researchers often need to work with pre-designed, fixed panels, including targets they’re not interested in.
What if you have a flexible and intelligent probe design process that allows you to fully customize your own panel for each new project, offering a high degree of freedom to target the genes of interest?
Accuracy
Although spatially-barcoded sequencing approaches have the advantages of mapping the whole transcriptome on a large tissue section, they are typically limited by either resolution and/or detection efficiency. These approaches utilize spotted arrays of transcript capturing probes on a slide to capture and sequence RNA from the tissues. However, the resolution of each spot is often larger than a cell, so each spot typically contains multiple different cells. Their arrayed distribution and distances between spots also hinder a granular view of each cell, their immediate neighbors, and their discrete expression profiles. In addition, due to their low detection efficiency, rare transcripts are often missed.
What if you had a system that could delivers a quantitative, spatially resolved view of subcellular biology, with each dot representing a single transcript? Learn more about Molecular Cartography here.
Probe size
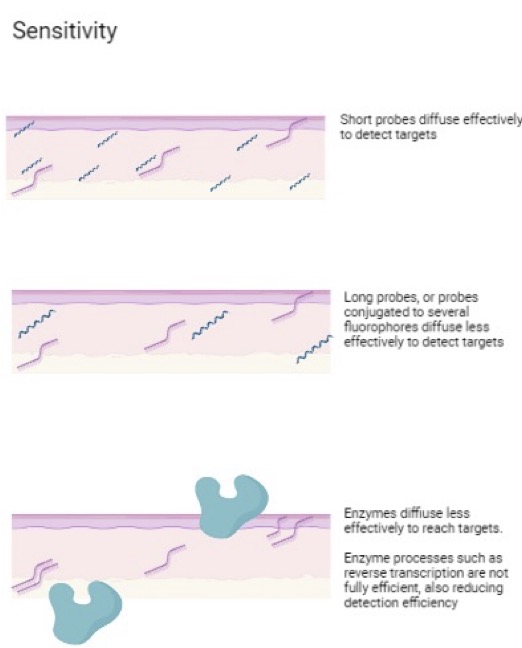
The length of probes used to detect the gene of interest significantly impacts the detection efficiency, since they need to freely diffuse into the sample. Some spatial transcriptomic technologies use longer probes, or probes conjugated to several fluorophores that could diffuse less effectively to detect targets (figure).
What if there was a more effective approach that could detect all possible transcripts with high specificity and sensitivity? Learn more about Molecular Cartography here.


