Technology
How does Molecular Cartography work?
Molecular Cartography is based on combinatorial single-molecule fluorescent in situ hybridization (smFISH). We hybridize several tens of transcript-specific probes per target RNA for analysis of up to 100 different types of RNA per sample. Through a proprietary colorizing and de-colorizing chemistry during several imaging rounds, our technology accurately identifies individual transcripts by decoding the barcode that is specific to each transcript type. This innovative approach enables Molecular Cartography to offer unprecedented specificity and sensitivity, with one spot corresponding to one transcript. The result is the visualization and identification of millions of individual transcripts per sample.
How does Molecular Cartography compare to other spatial technologies?
Molecular Cartography is an imaging-based technology offering much higher resolution and sensitivity than existing sequencing-based approaches. Sequencing-based spatial technologies rely on the elution of target RNAs from tissues and hybridization to large areas with a finite amount of capture oligos. This limits their sensitivity to highly expressed genes and makes cellular resolution with high sensitivity unachievable. Our technology offers a resolution of ~300nm in x, y, and z coordinates, allowing for subcellular, single-molecule detection of individual transcripts with the same detection sensitivity as smFISH. To achieve this level of sensitivity, Molecular Cartography does not use any amplification or enzymatic reactions as opposed to rolling circle or hybridization-chain reaction amplification-based spatial technologies.
How does Molecular Cartography differ from other spatial technologies?
Molecular Cartography is more versatile than competing hybridization-based technologies. It’s compatible with shorter transcripts (min. 500nt) and can detect more coding genes. Molecular Cartography is also non-destructive and does not require tissue clearing, enabling downstream applications such as immunohistochemistry.
Can I use my sample for follow-up experiments after Molecular Cartography?
Yes. Molecular Cartography is a non-destructive technology that preserves sample integrity. However, epitope landscapes for antibody-based follow-ups might be altered by the experiment.
How many unique transcripts per sample can Molecular Cartography detect?
Molecular Cartography can currently detect up to 100 different RNA molecules per sample.
How sensitive is the technology?
The detection sensitivity of Molecular Cartography is similar to single-molecule FISH, the gold standard for sensitive spatial transcriptomics. Moreover, comparing our data to bulk RNAseq, we see a linear correlation between <1 TPM and >1000 TPM.
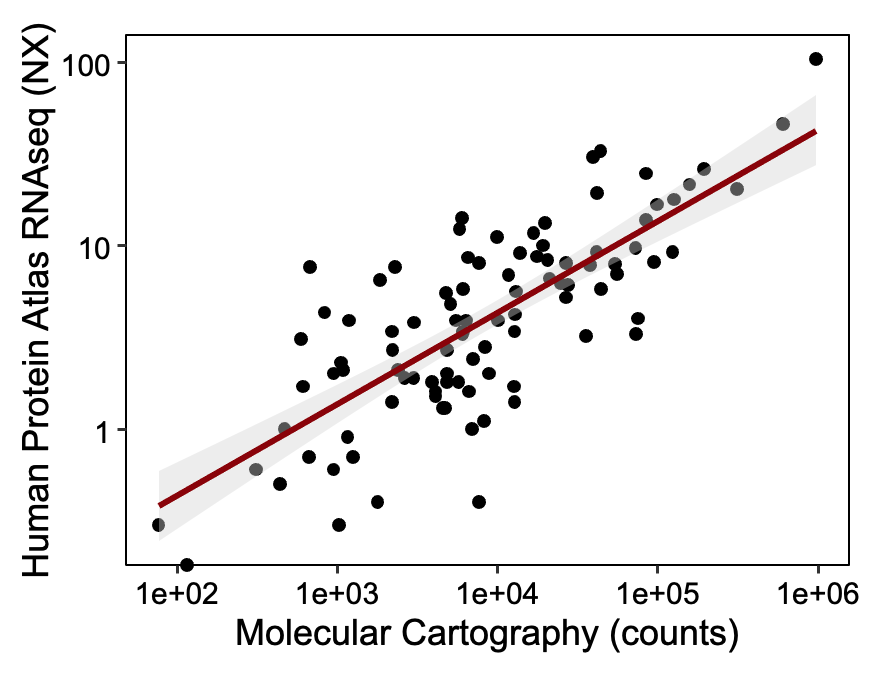
Table 1: Publicly available RNAseq expression from the human protein atlas and Molecular Cartography counts from mouse cortex. Pearson R² = 0.9.
What about specificity? How can you confirm the transcripts identified are correct?
Molecular Cartography uses an error-robust barcode that requires the detection of molecules in different imaging channels and several imaging rounds to reliably remove false-positive signals. In addition, unspecific binding of probes is unlikely to lead to false positives given that multiple probes bind to the same target, which adds redundancy. False- positive rates are calculated based on the detection of unused control barcodes and reported for every experiment.
What is the resolution?
The resolution is ~300nm in x, y, and z coordinates per spot, allowing for subcellular, single-molecule detection of individual transcripts.
Can you detect SNPs, indels, and CNVs?
Currently, we do not support SNP, indel, and CNV detection. Multiple transcript-specific probes to cover the target RNA with a minimum length of 500 nucleotides are required for accurate target detection.
How long does a typical Molecular Cartography experiment take?
Each slide containing eight samples can be processed in 3 to 5 days from hybridization to finished primary analysis.
Sample compatibility
What should I consider for best results with Molecular Cartography
Samples should:
- have good RNA integrity
- retain their structure during sectioning
- adhere well to the provided Poly-L-Lysine -coated glass slides
- have low auto-fluorescence during imaging
Each tissue type is unique, so if you are unsure how to best prepare your samples, please talk with your local Customer Technology Advisor.
Which species are compatible with Molecular Cartography?
Our probe designs are currently compatible with a wide range of species such as mammals, fish, amphibians, insects, plants, and more.
Is Molecular Cartography compatible with FFPE tissues?
Molecular Cartography is generally compatible with FFPE. However, not all FFPE samples are created equal. Please speak with your local Customer Technology Advisor about your specific sample needs.
Do you support fresh-frozen tissues?
Yes. Molecular Cartography is compatible with unfixed samples frozen using dry ice-cooled isopentane, and with tissues fixed in paraformaldehyde or PAXgene®. Protocols for multiple fixation methods are available for download in your customer portal. Tissues collected from Biobanks that are frozen for histology can also be processed with Molecular Cartography.
How thick can my tissue slices be?
Molecular Cartography is currently compatible with 10µm-thick sections of tissues and organoids or cultured cells.
Can I use my own slides?
No. The thickness and optical properties of the Molecular Cartography slides are key to workflow performance and data quality.
Is Molecular Cartography compatible with downstream staining?
Yes. Molecular Cartography is non-destructive, meaning no sample clearing or proteinase-K reagents are used during the workflow. This makes it possible for samples to be probed with antibodies or dyes after data generation. However, the epitope landscape of samples might be altered, and we recommend optimizing protocols and testing antibodies beforehand
Is Molecular Cartography compatible with samples expressing Green Fluorescent Protein (GFP), Yellow Fluorescent Protein (YFP), or dTomato?
GFP expression is compatible with Molecular Cartography. YFP and dTomato are very sample-specific and would need optimization. Please contact your local Customer Technology Advisor for detailed information.
Target Transcripts / Probe Design
Which RNAs can be targeted?
Molecular Cartography is based on the hybridization of multiple probes to a given transcript, which requires a defined amount of unique, non-repetitive RNA sequences. Molecular Cartography can reliably probe most transcripts exceeding 500nt. This is sufficient to detect many lncRNAs but excludes short non-coding RNAs like miRNA or tRNAs.
Can you differentiate isoforms?
Only if there is sufficient sequence space to reliably distinguish two isoforms (>500nt; see above). This is not the case for many genes and is currently not covered by the design pipeline. It would be part of a custom offering.
Which parts of the transcript do the probes target?
Probes preferentially target coding sequences but will also be placed in untranslated regions (UTRs) depending on the in silico hybridization properties of the sequence and length of a given transcript. Designs can be chosen to either target as many isoforms as possible – with a focus on principal isoforms – or prioritize detection of a specific transcript.
Sample Preparation
How do I freeze my tissue samples?
Samples can be frozen in dry ice-cooled isopentane without fixation or after fixation and cryo-protection in a sucrose solution.
Please watch the sample freezing video for more context, or contact your local Customer Technology Advisor:
Sample Preparation Tutorial Part I: How to Freeze Your Tissue Samples to Ensure High-Quality Results?
Is it necessary to embed my samples in Optimal Cutting Temperature Compound (OCT)?
For many larger samples, OCT embedding is not required. If OCT is only used to attach the sample to the cryostat, sample size is limited and placement on Molecular Cartography slides can be easier. However, small and fragile samples often require OCT embedding for easy handling during sectioning and sample placement.
Can I put multiple samples into one placement area?
Yes. You will be able to target multiple regions of one large sample or multiple smaller samples in the same placement area. Smaller samples are ideally placed in the same OCT block before sectioning.
Target Regions
Can I put multiple samples into one placement area?
Yes. You will be able to target multiple regions of one large sample or multiple smaller samples in the same placement area. Smaller samples are ideally placed in the same OCT block before sectioning.
How large are the regions that can be imaged?
Molecular Cartography uses slides with 8 placement areas. Each placement area is 1cm2. In total, no more than 26mm2 can be imaged across all samples.
How many regions can be imaged per sample/placement area?
An unlimited number of regions can be imaged as long as the total sample area processed in an experiment does not exceed 26mm2 per slide.
Data and Analysis
How do I segment my cells?
The easiest way to segment cells is via the provided DAPI signals. We recommend QuPath, but other tools are also available. Alternatively, custom segmentation pipelines can be used, as long as the location of the cells is imported into an ImageJ plugin as ROIs.
Do you provide analysis software? Is it compatible with other analysis tools?
Yes, we provide a web-based analysis tool for data visualization and analysis. In addition, we offer an ImageJ plugin to maximize compatibility with existing image processing pipelines. Molecular Cartography is fully digital and transcript information is available as coordinates that can be easily exported into other platforms for further custom analysis.
What type of data do I receive?
Our intuitive web-based analysis tools make it easy to visualize and analyse your data. For each target region you select, you will receive the DAPI images and the coordinates for all target molecules detected in text file format. You will also receive a data summary report.
Service
How long does it take you to generate data from my samples?
From the moment probes are synthesised to data delivery, it takes 6-8 weeks.

